RESEARCH AREA
Global Leader Providing Scientific & Innovative Solution
RESEARCH AREA
IN VITRO TEST
IN VITRO TEST
| Cytotoxicity test | |
|---|---|
Content |
Cytotoxicity analysis |
Period |
3 weeks |
Figure/Image |
Graph |
| Anti-wrinkle efficacy test | |
|---|---|
Content |
Skin wrinkle related gene expression analysis |
Period |
4 weeks |
Figure/Image |
Graph |
| Anti-wrinkle efficacy test | |
|---|---|
Content |
Collagen1 protein expression analysis |
Period |
4 weeks |
Figure/Image |
Graph |
| Anti-wrinkle efficacy test | |
|---|---|
Content |
Procollagen protein expression analysis |
Period |
4 weeks |
Figure/Image |
Graph |
| Anti-wrinkle efficacy test | |
|---|---|
Content |
MMP1 (collagenase) protein expression analysis |
Period |
4 weeks |
Figure/Image |
Graph |
| Anti-wrinkle efficacy test | |
|---|---|
Content |
Elastase inhibition analysis |
Period |
4 weeks |
Figure/Image |
Graph |
| Anti-wrinkle efficacy test | |
|---|---|
Content |
Aging model design by light (UV or bluelight)-Ex vivo |
Period |
4 weeks |
Figure/Image |
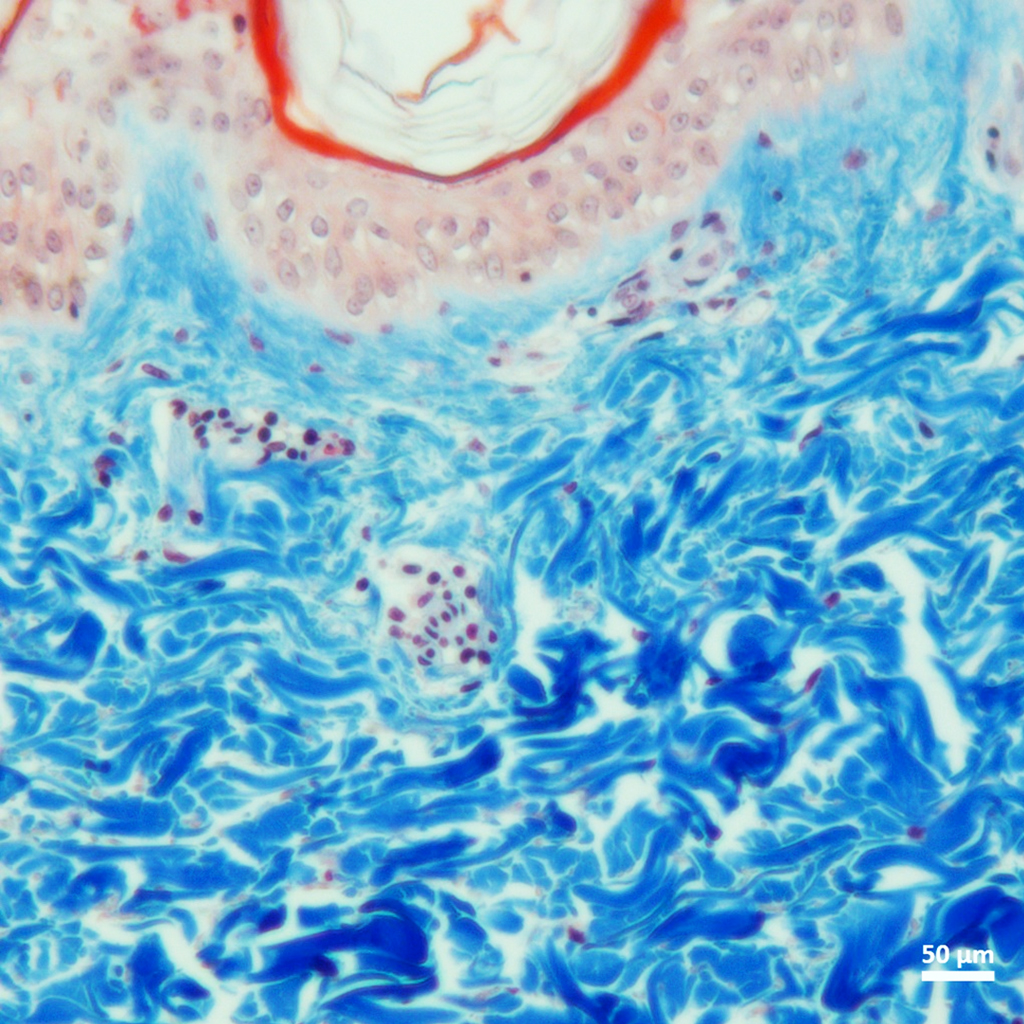 Negative Control Group
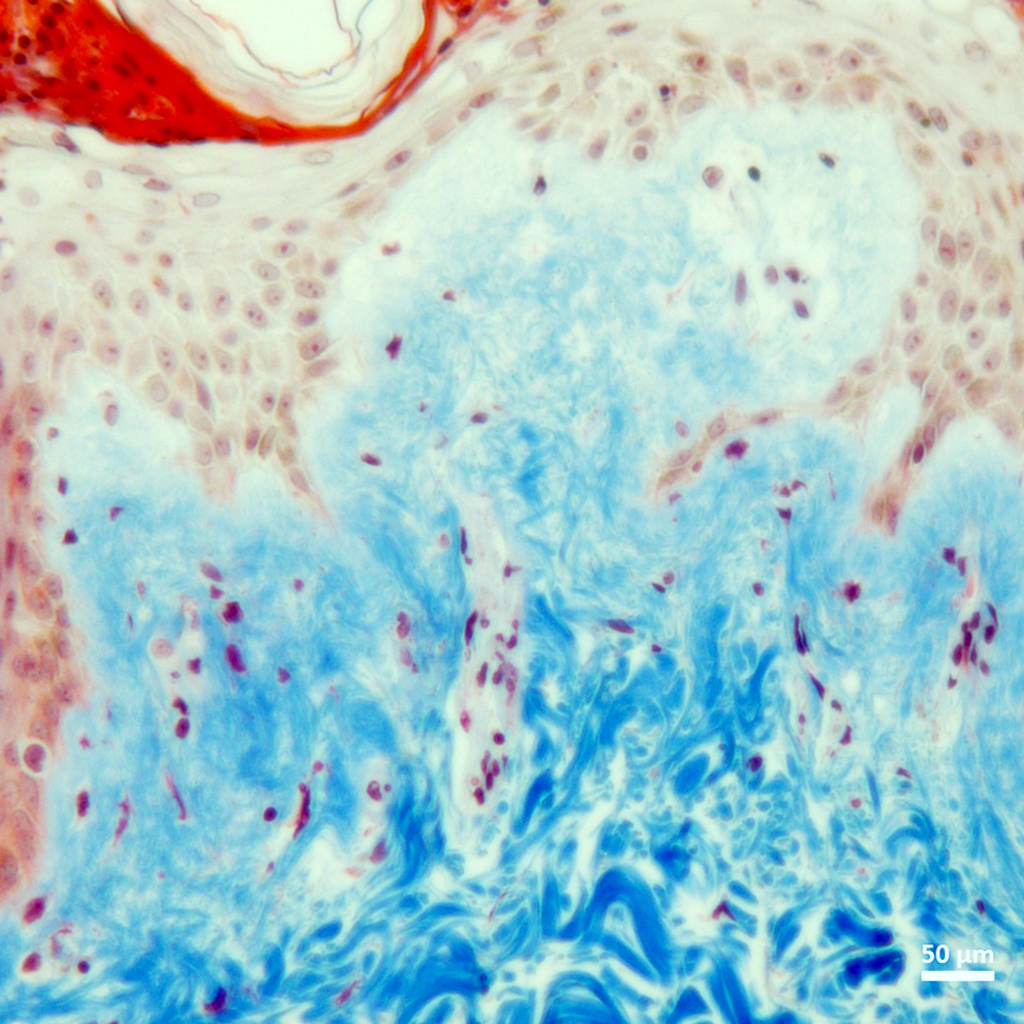 UVB-irradiated Group
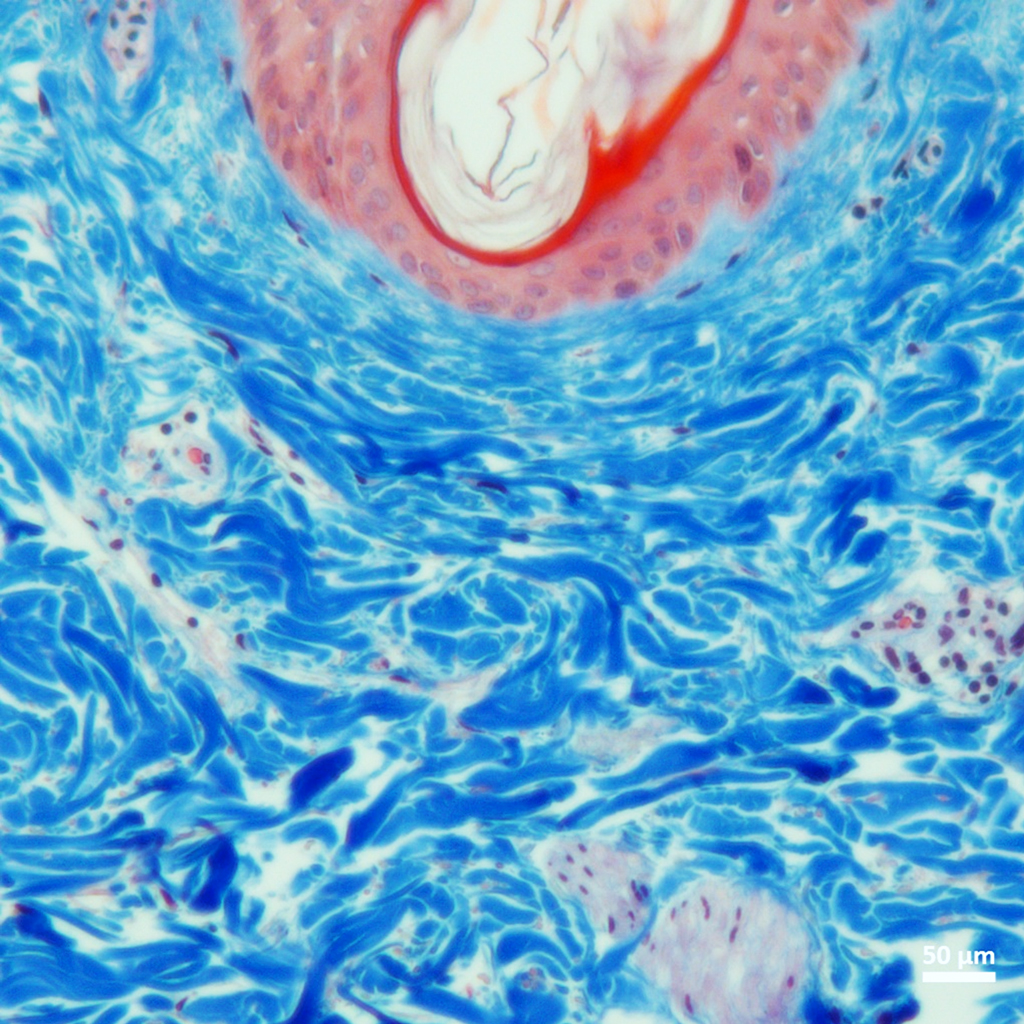 Test Group
|
| Whitening efficacy test | |
|---|---|
Content |
Skin whitening related gene expression analysis |
Period |
4 weeks |
Figure/Image |
Graph |
| Whitening efficacy test | |
|---|---|
Content |
Melanin production analysis |
Period |
4 weeks |
Figure/Image |
Graph |
| Whitening efficacy test | |
|---|---|
Content |
L-DOPA oxidation inhibition analysis |
Period |
4 weeks |
Figure/Image |
Graph |
| Whitening efficacy test | |
|---|---|
Content |
Tyrosinase inhibition analysis |
Period |
4 weeks |
Figure/Image |
Graph |
| Anti-oxidant efficay test | |
|---|---|
Content |
DPPH radical scavenging activity analysis |
Period |
2 weeks |
Figure/Image |
Graph |
| Anti-oxidant efficay test | |
|---|---|
Content |
ORAC antioxidant value analysis |
Period |
2 weeks |
Figure/Image |
Graph |
| Anti-oxidant efficay test | |
|---|---|
Content |
ROS analysis |
Period |
4 weeks |
Figure/Image |
Graph |
| Anti-oxidant efficay test | |
|---|---|
Content |
Antioxidant enzyme analysis in skin corneous |
Period |
6 weeks |
Figure/Image |
Graph |
| Anti-diabetic efficacy test | |
|---|---|
Content |
α-glucosidase inhibition analysis |
Period |
4 weeks |
Figure/Image |
Graph |
| Anti-glycosylation efficacty test | |
|---|---|
Content |
Advanced glycation end products (AGEs) analysis |
Period |
4 weeks |
Figure/Image |
Graph |
| Anti-glycosylation efficacty test | |
|---|---|
Content |
Denatured collagen production analysis |
Period |
4 weeks |
Figure/Image |
Image |
| Anti-obesity efficacy test | |
|---|---|
Content |
Adipogenesis related gene expression analysis |
Period |
8 weeks |
Figure/Image |
Graph |
| Anti-obesity efficacy test | |
|---|---|
Content |
Adipocytes lipid uptake analysis |
Period |
8 weeks |
Figure/Image |
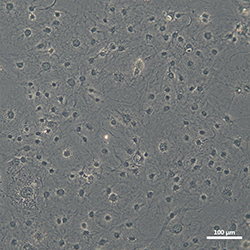 Negative Control Group
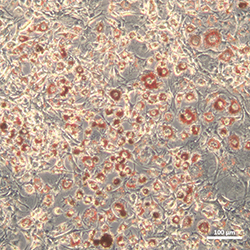 Adipogenesis-induced Group
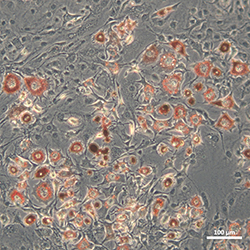 Test Group
|
| Moisturizing efficacy test | |
|---|---|
Content |
Skin moisturizing related gene expression analysis |
Period |
4 weeks |
Figure/Image |
Graph |
| Moisturizing efficacy test | |
|---|---|
Content |
Skin barrier related gene expression analysis |
Period |
4 weeks |
Figure/Image |
Graph |
| Wound healing efficacy test | |
|---|---|
Content |
Scratch wound healing assay |
Period |
4 weeks |
Figure/Image |
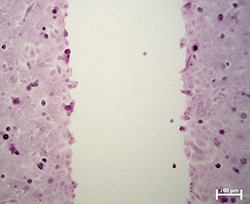 Negative Control Group
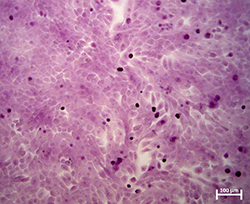 Test Group
|
| Anti-inflammation efficacy test | |
|---|---|
Content |
Inflammation model design-Ex vivo |
Period |
12 weeks |
Figure/Image |
Graph |
| Anti-inflammation efficacy test | |
|---|---|
Content |
Anti-inflammation related gene expression analysis |
Period |
4 weeks |
Figure/Image |
Graph |
| Anti-inflammation efficacy test | |
|---|---|
Content |
B cell- IgE concentration analysis |
Period |
6 weeks |
Figure/Image |
Graph |
| Anti-inflammation efficacy test | |
|---|---|
Content |
Mast cell - Histamin or IL-6 analysis |
Period |
6 weeks |
Figure/Image |
Graph |
| Anti-inflammation efficacy test | |
|---|---|
Content |
Macrophage - TNFα or IL-6 analysis |
Period |
6 weeks |
Figure/Image |
Graph |
| Anti-inflammation efficacy test | |
|---|---|
Content |
Keratinocyte - TARC analysis |
Period |
6 weeks |
Figure/Image |
Graph |
| Microdust efficacy test | |
|---|---|
Content |
Inflammation or skin barrier related gene expression analysis |
Period |
8 weeks |
Figure/Image |
Graph |
| Microdust efficacy test | |
|---|---|
Content |
Anti-inflammation related gene expression analysis |
Period |
8 weeks |
Figure/Image |
Graph |
| Microdust efficacy test | |
|---|---|
Content |
ROS analysis |
Period |
8 weeks |
Figure/Image |
Image |
| Skin absorption efficacy test | |
|---|---|
Content |
Absorption analysis in skin model |
Period |
6 weeks |
Figure/Image |
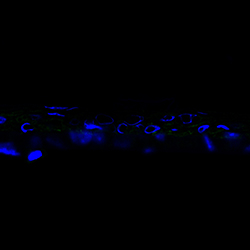 Negative Control Group
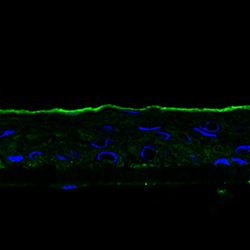 Test Group
|
| Alternatives to the eye irritation test | |
|---|---|
Content |
Retinal cell viability analysis |
Period |
4 weeks |
Figure/Image |
Graph |
| Anti-hair loss efficacy test | |
|---|---|
Content |
Human follicle dermal papilla cell proliferation analysis |
Period |
3 weeks |
Figure/Image |
Graph |
| Anti-hair loss efficacy test | |
|---|---|
Content |
Hair loss related gene expression analysis |
Period |
4 weeks |
Figure/Image |
Graph |
| Hair improvement efficay test | |
|---|---|
Content |
InfIltration analysis of fluorescent protein to hair |
Period |
2 weeks/4 weeks |
Figure/Image |
Image |
| Hair improvement efficay test | |
|---|---|
Content |
Hair roughness analysis |
Period |
4 weeks |
Figure/Image |
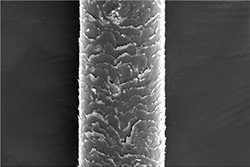 Control Group
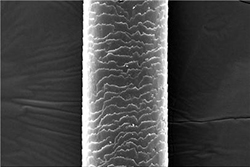 Test Group
|
| Anti-microbial activity in vitro | |
|---|---|
Content |
Escherichia coli/Staphylococcus aureus/Candida albicans |
Period |
3 weeks |
Figure/Image |
Image |
| Anti-microbial efficacy test | |
|---|---|
Content |
Escherichia coli/Staphylococcus aureus/Candida albicans |
Period |
3 weeks |
Figure/Image |
Image |
| Test | Content | Period | Figure/Image |
|---|---|---|---|
|
Cytotoxicity test |
Cytotoxicity analysis | 3 weeks | Graph |
|
Anti-wrinkle efficacy test |
Skin wrinkle related gene expression analysis | 4 weeks | Graph |
| Collagen1 protein expression analysis | 4 weeks | Graph | |
| Procollagen protein expression analysis | 4 weeks | Graph | |
| MMP1 (collagenase) protein expression analysis | 4 weeks | Graph | |
| Elastase inhibition analysis | 4 weeks | Graph | |
| Aging model design by light (UV or bluelight)-Ex vivo | 6 weeks |
Images View
 Negative Control Group
 UVB-irradiated Group
 Test Group
|
|
|
Whitening efficacy test |
Skin whitening related gene expression analysis | 4 weeks | Graph |
| Melanin production analysis | 4 weeks | Graph | |
| L-DOPA oxidation inhibition analysis | 4 weeks | Graph | |
| Tyrosinase inhibition analysis | 4 weeks | Graph | |
|
Anti-oxidant efficay test |
DPPH radical scavenging activity analysis | 2 weeks | Graph |
| ORAC antioxidant value analysis | 2 weeks | Graph | |
| ROS analysis | 4 weeks | Graph | |
| Antioxidant enzyme analysis in skin corneous | 6 weeks | Graph | |
|
Anti-diabetic efficacy test |
α-glucosidase inhibition analysis | 4 weeks | Graph |
|
Anti-glycosylation efficacty test |
Advanced glycation end products (AGEs) analysis | 4 weeks | Graph |
| Denatured collagen production analysis | 4 weeks | Image | |
|
Anti-obesity efficacy test |
Adipogenesis related gene expression analysis | 8 weeks | Graph |
| Adipocytes lipid uptake analysis | 8 weeks |
Images View
 Negative Control Group
 Adipogenesis-induced Group
 Test Group
|
|
|
Moisturizing efficacy test |
Skin moisturizing related gene expression analysis | 4 weeks | Graph |
| Skin barrier related gene expression analysis | 4 weeks | Graph | |
|
Wound healing efficacy test |
Scratch wound healing assay | 4 weeks |
Images View
 Negative Control Group
 Test Group
|
|
Anti-inflammation efficacy test |
Inflammation model design-Ex vivo | 12 weeks | Graph |
| Anti-inflammation related gene expression analysis | 4 weeks | Graph | |
| B cell- IgE concentration analysis | 6 weeks | Graph | |
| Mast cell - Histamin or IL-6 analysis | 6 weeks | Graph | |
| Macrophage - TNFα or IL-6 analysis | 6 weeks | Graph | |
| Keratinocyte - TARC analysis | 6 weeks | Graph | |
|
Microdust efficacy test |
Inflammation or skin barrier related gene expression analysis | 8 weeks | Graph |
| Anti-inflammation related gene expression analysis | 8 weeks | Graph | |
| ROS analysis | 8 weeks | Image | |
|
Skin absorption efficacy test |
Absorption analysis in skin model | 6 weeks |
Images View
 Negative Control Group
 Test Group
|
|
Alternatives to the eye irritation test |
Retinal cell viability analysis | 4 weeks | Graph |
|
Anti-hair loss efficacy test |
Human follicle dermal papilla cell proliferation analysis | 3 weeks | Graph |
| Hair loss related gene expression analysis | 4 weeks | Graph | |
|
Hair improvement efficay test |
InfIltration analysis of fluorescent protein to hair | 2 weeks/4 weeks | Image |
| Hair roughness analysis | 4 weeks |
Images View
 Control Group
 Test Group
|
|
|
Anti-microbial activity in vitro |
Escherichia coli/Staphylococcus aureus/Candida albicans | 3 weeks | Image |
|
Anti-microbial efficacy test |
Escherichia coli/Staphylococcus aureus/Candida albicans | 3 weeks | Image |
| Cytotoxicity test | |
|---|---|
Content |
Cytotoxicity analysis |
Period |
3 weeks |
Figure/Image |
Graph |
| Test | Content | Period | Figure/Image |
|---|---|---|---|
|
Cytotoxicity test |
Cytotoxicity analysis | 3 weeks | Graph |
| Anti-wrinkle efficacy test | |
|---|---|
Content |
Skin wrinkle related gene expression analysis |
Period |
4 weeks |
Figure/Image |
Graph |
| Anti-wrinkle efficacy test | |
|---|---|
Content |
Collagen1 protein expression analysis |
Period |
4 weeks |
Figure/Image |
Graph |
| Anti-wrinkle efficacy test | |
|---|---|
Content |
Procollagen protein expression analysis |
Period |
4 weeks |
Figure/Image |
Graph |
| Anti-wrinkle efficacy test | |
|---|---|
Content |
MMP1 (collagenase) protein expression analysis |
Period |
4 weeks |
Figure/Image |
Graph |
| Anti-wrinkle efficacy test | |
|---|---|
Content |
Elastase inhibition analysis |
Period |
4 weeks |
Figure/Image |
Graph |
| Anti-wrinkle efficacy test | |
|---|---|
Content |
Aging model design by light (UV or bluelight)-Ex vivo |
Period |
4 weeks |
Figure/Image |
 Negative Control Group
 UVB-irradiated Group
 Test Group
|
| Test | Content | Period | Figure/Image |
|---|---|---|---|
|
Anti-wrinkle efficacy test |
Skin wrinkle related gene expression analysis | 4 weeks | Graph |
| Collagen1 protein expression analysis | 4 weeks | Graph | |
| Procollagen protein expression analysis | 4 weeks | Graph | |
| MMP1 (collagenase) protein expression analysis | 4 weeks | Graph | |
| Elastase inhibition analysis | 4 weeks | Graph | |
| Aging model design by light (UV or bluelight)-Ex vivo | 6 weeks |
Images View
 Negative Control Group
 UVB-irradiated Group
 Test Group
|
| Whitening efficacy test | |
|---|---|
Content |
Skin whitening related gene expression analysis |
Period |
4 weeks |
Figure/Image |
Graph |
| Whitening efficacy test | |
|---|---|
Content |
Melanin production analysis |
Period |
4 weeks |
Figure/Image |
Graph |
| Whitening efficacy test | |
|---|---|
Content |
L-DOPA oxidation inhibition analysis |
Period |
4 weeks |
Figure/Image |
Graph |
| Whitening efficacy test | |
|---|---|
Content |
Tyrosinase inhibition analysis |
Period |
4 weeks |
Figure/Image |
Graph |
| Test | Content | Period | Figure/Image |
|---|---|---|---|
|
Whitening efficacy test |
Skin whitening related gene expression analysis | 4 weeks | Graph |
| Melanin production analysis | 4 weeks | Graph | |
| L-DOPA oxidation inhibition analysis | 4 weeks | Graph | |
| Tyrosinase inhibition analysis | 4 weeks | Graph |
| Anti-oxidant efficay test | |
|---|---|
Content |
DPPH radical scavenging activity analysis |
Period |
2 weeks |
Figure/Image |
Graph |
| Anti-oxidant efficay test | |
|---|---|
Content |
ORAC antioxidant value analysis |
Period |
2 weeks |
Figure/Image |
Graph |
| Anti-oxidant efficay test | |
|---|---|
Content |
ROS analysis |
Period |
4 weeks |
Figure/Image |
Graph |
| Anti-oxidant efficay test | |
|---|---|
Content |
Antioxidant enzyme analysis in skin corneous |
Period |
6 weeks |
Figure/Image |
Graph |
| Test | Content | Period | Figure/Image |
|---|---|---|---|
|
Anti-oxidant efficay test |
DPPH radical scavenging activity analysis | 2 weeks | Graph |
| ORAC antioxidant value analysis | 2 weeks | Graph | |
| ROS analysis | 4 weeks | Graph | |
| Antioxidant enzyme analysis in skin corneous | 6 weeks | Graph |
| Anti-diabetic efficacy test | |
|---|---|
Content |
α-glucosidase inhibition analysis |
Period |
4 weeks |
Figure/Image |
Graph |
| Test | Content | Period | Figure/Image |
|---|---|---|---|
|
Anti-diabetic efficacy test |
α-glucosidase inhibition analysis | 4 weeks | Graph |
| Anti-glycosylation efficacty test | |
|---|---|
Content |
Advanced glycation end products (AGEs) analysis |
Period |
4 weeks |
Figure/Image |
Graph |
| Anti-glycosylation efficacty test | |
|---|---|
Content |
Denatured collagen production analysis |
Period |
4 weeks |
Figure/Image |
Image |
| Test | Content | Period | Figure/Image |
|---|---|---|---|
|
Anti-glycosylation efficacty test |
Advanced glycation end products (AGEs) analysis | 4 weeks | Graph |
| Denatured collagen production analysis | 4 weeks | Image |
| Anti-obesity efficacy test | |
|---|---|
Content |
Adipogenesis related gene expression analysis |
Period |
8 weeks |
Figure/Image |
Graph |
| Anti-obesity efficacy test | |
|---|---|
Content |
Adipocytes lipid uptake analysis |
Period |
8 weeks |
Figure/Image |
 Negative Control Group
 Adipogenesis-induced Group
 Test Group
|
| Test | Content | Period | Figure/Image |
|---|---|---|---|
|
Anti-obesity efficacy test |
Adipogenesis related gene expression analysis | 8 weeks | Graph |
| Adipocytes lipid uptake analysis | 8 weeks |
Images View
 Negative Control Group
 Adipogenesis-induced Group
 Test Group
|
| Moisturizing efficacy test | |
|---|---|
Content |
Skin moisturizing related gene expression analysis |
Period |
4 weeks |
Figure/Image |
Graph |
| Moisturizing efficacy test | |
|---|---|
Content |
Skin barrier related gene expression analysis |
Period |
4 weeks |
Figure/Image |
Graph |
| Test | Content | Period | Figure/Image |
|---|---|---|---|
|
Moisturizing efficacy test |
Skin moisturizing related gene expression analysis | 4 weeks | Graph |
| Skin barrier related gene expression analysis | 4 weeks | Graph |
| Wound healing efficacy test | |
|---|---|
Content |
Scratch wound healing assay |
Period |
4 weeks |
Figure/Image |
 Negative Control Group
 Test Group
|
| Test | Content | Period | Figure/Image |
|---|---|---|---|
|
Wound healing efficacy test |
Scratch wound healing assay | 4 weeks |
Images View
 Negative Control Group
 Test Group
|
| Anti-inflammation efficacy test | |
|---|---|
Content |
Inflammation model design-Ex vivo |
Period |
12 weeks |
Figure/Image |
Graph |
| Anti-inflammation efficacy test | |
|---|---|
Content |
Anti-inflammation related gene expression analysis |
Period |
4 weeks |
Figure/Image |
Graph |
| Anti-inflammation efficacy test | |
|---|---|
Content |
B cell- IgE concentration analysis |
Period |
6 weeks |
Figure/Image |
Graph |
| Anti-inflammation efficacy test | |
|---|---|
Content |
Mast cell - Histamin or IL-6 analysis |
Period |
6 weeks |
Figure/Image |
Graph |
| Anti-inflammation efficacy test | |
|---|---|
Content |
Macrophage - TNFα or IL-6 analysis |
Period |
6 weeks |
Figure/Image |
Graph |
| Anti-inflammation efficacy test | |
|---|---|
Content |
Keratinocyte - TARC analysis |
Period |
6 weeks |
Figure/Image |
Graph |
| Test | Content | Period | Figure/Image |
|---|---|---|---|
|
Anti-inflammation efficacy test |
Inflammation model design-Ex vivo | 12 weeks | Graph |
| Anti-inflammation related gene expression analysis | 4 weeks | Graph | |
| B cell- IgE concentration analysis | 6 weeks | Graph | |
| Mast cell - Histamin or IL-6 analysis | 6 weeks | Graph | |
| Macrophage - TNFα or IL-6 analysis | 6 weeks | Graph | |
| Keratinocyte - TARC analysis | 6 weeks | Graph |
| Microdust efficacy test | |
|---|---|
Content |
Inflammation or skin barrier related gene expression analysis |
Period |
8 weeks |
Figure/Image |
Graph |
| Microdust efficacy test | |
|---|---|
Content |
Anti-inflammation related gene expression analysis |
Period |
8 weeks |
Figure/Image |
Graph |
| Microdust efficacy test | |
|---|---|
Content |
ROS analysis |
Period |
8 weeks |
Figure/Image |
Image |
| Test | Content | Period | Figure/Image |
|---|---|---|---|
|
Microdust efficacy test |
Inflammation or skin barrier related gene expression analysis | 8 weeks | Graph |
| Anti-inflammation related gene expression analysis | 8 weeks | Graph | |
| ROS analysis | 8 weeks | Image |
| Skin absorption efficacy test | |
|---|---|
Content |
Absorption analysis in skin model |
Period |
6 weeks |
Figure/Image |
 Negative Control Group
 Test Group
|
| Test | Content | Period | Figure/Image |
|---|---|---|---|
|
Skin absorption efficacy test |
Absorption analysis in skin model | 6 weeks |
Images View
 Negative Control Group
 Test Group
|
| Alternatives to the eye irritation test | |
|---|---|
Content |
Retinal cell viability analysis |
Period |
4 weeks |
Figure/Image |
Graph |
| Test | Content | Period | Figure/Image |
|---|---|---|---|
|
Alternatives to the eye irritation test |
Retinal cell viability analysis | 4 weeks | Graph |
| Anti-hair loss efficacy test | |
|---|---|
Content |
Human follicle dermal papilla cell proliferation analysis |
Period |
3 weeks |
Figure/Image |
Graph |
| Anti-hair loss efficacy test | |
|---|---|
Content |
Hair loss related gene expression analysis |
Period |
4 weeks |
Figure/Image |
Graph |
| Test | Content | Period | Figure/Image |
|---|---|---|---|
|
Anti-hair loss efficacy test |
Human follicle dermal papilla cell proliferation analysis | 3 weeks | Graph |
| Hair loss related gene expression analysis | 4 weeks | Graph |
| Hair improvement efficay test | |
|---|---|
Content |
InfIltration analysis of fluorescent protein to hair |
Period |
2 weeks/4 weeks |
Figure/Image |
Image |
| Hair improvement efficay test | |
|---|---|
Content |
Hair roughness analysis |
Period |
4 weeks |
Figure/Image |
 Control Group
 Test Group
|
| Test | Content | Period | Figure/Image |
|---|---|---|---|
|
Hair improvement efficay test |
InfIltration analysis of fluorescent protein to hair | 2 weeks/4 weeks | Image |
| Hair roughness analysis | 4 weeks |
Images View
 Control Group
 Test Group
|
| Anti-microbial activity in vitro | |
|---|---|
Content |
Escherichia coli/Staphylococcus aureus/Candida albicans |
Period |
3 weeks |
Figure/Image |
Image |
| Test | Content | Period | Figure/Image |
|---|---|---|---|
|
Anti-microbial activity in vitro |
Escherichia coli/Staphylococcus aureus/Candida albicans | 3 weeks | Image |
| Anti-microbial efficacy test | |
|---|---|
Content |
Escherichia coli/Staphylococcus aureus/Candida albicans |
Period |
3 weeks |
Figure/Image |
Image |
| Test | Content | Period | Figure/Image |
|---|---|---|---|
|
Anti-microbial efficacy test |
Escherichia coli/Staphylococcus aureus/Candida albicans | 3 weeks | Image |